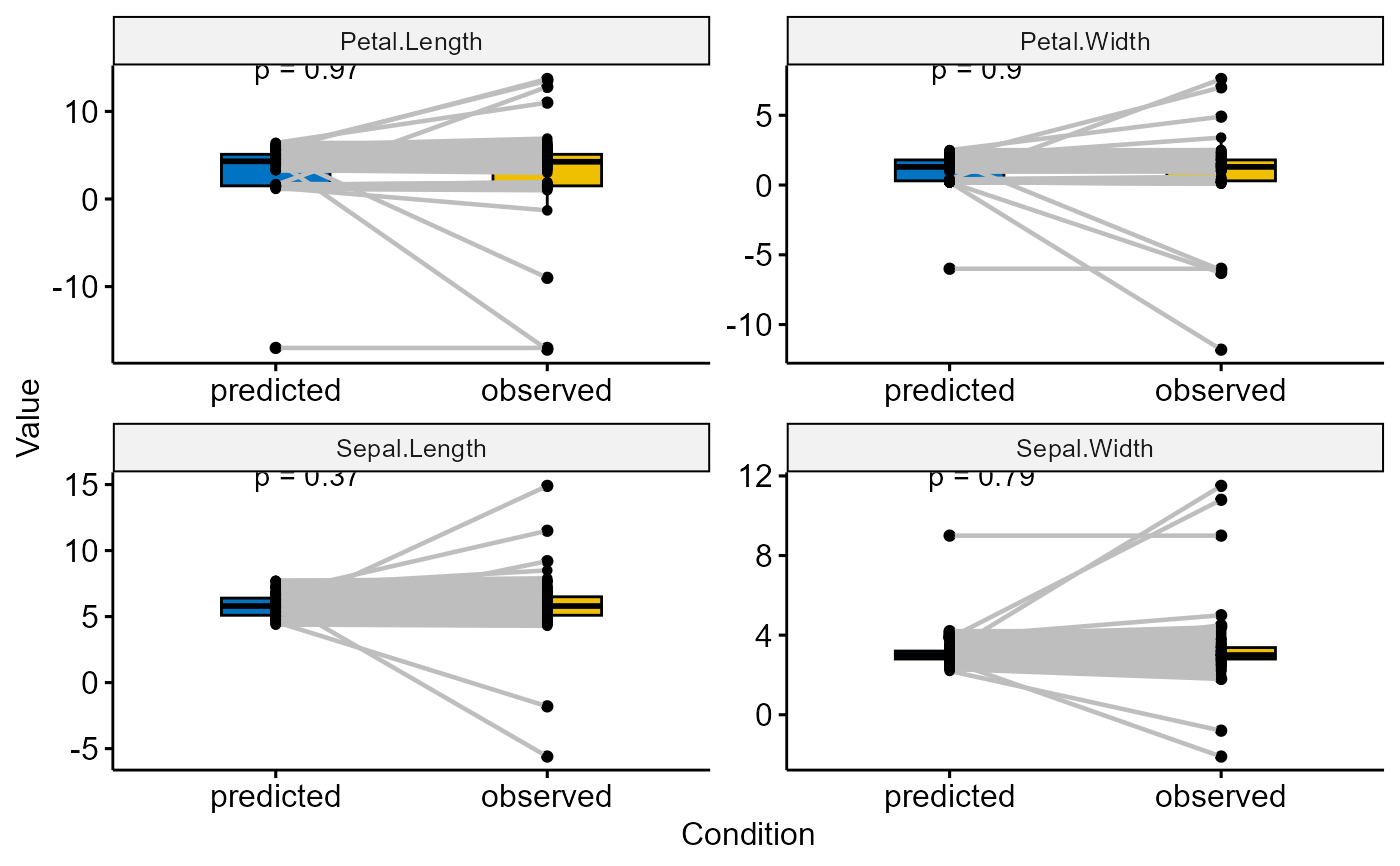
This function can plot paired boxplot of an "outqrf" object. It helps us to better observe the relationship between the original and predicted values
Usage
# S3 method for class 'outqrf'
plot(x, ...)Examples
irisWithOutliers <- generateOutliers(iris, seed = 2024)
qrf <- outqrf(irisWithOutliers)
#>
#> Outlier identification by quantiles random forests
#>
#>   Variables to check:		Sepal.Length, Sepal.Width, Petal.Length, Petal.Width
#>   Variables used to check:	Sepal.Length, Sepal.Width, Petal.Length, Petal.Width, Species
#>
#>   Checking: Sepal.Length  Sepal.Width  Petal.Length  Petal.Width
plot(qrf)