Create boxplots showing how anomalous points compare to the overall feature distributions. All data points are shown as small black dots, with the anomalous point(s) highlighted in red (or custom color) for easy identification. Can work with or without a contribution object.
Usage
plot_anomaly_boxplot(
  contribution_obj = NULL,
  data,
  sample_id = NULL,
  top_n = 5,
  highlight_color = "red",
  highlight_size = 3,
  highlight_shape = 17,
  show_contribution = TRUE
)
Arguments
- contribution_obj
A feature_contribution object from feature_contribution(), or NULL. If NULL, you can specify multiple sample_ids to highlight multiple anomalies.
- data
The original training data
- sample_id
The sample ID(s) to visualize. Can be a single value or a vector.
If contribution_obj is provided: only single value is used
If contribution_obj is NULL: can be a vector to mark multiple anomalies
If NULL and contribution_obj provided: uses first sample from contribution_obj
- top_n
Number of top contributing features to display (default 5, NULL for all). Only used when contribution_obj is provided.
- highlight_color
Color for the anomaly point(s) (default "red")
- highlight_size
Size of the anomaly point(s) (default 3). Automatically adjusted to 1 when >5 anomalies are highlighted
- highlight_shape
Shape of the anomaly point(s) (default 17, not used currently)
- show_contribution
Whether to show contribution percentages in labels (default TRUE). Only applies when contribution_obj is provided.
Examples
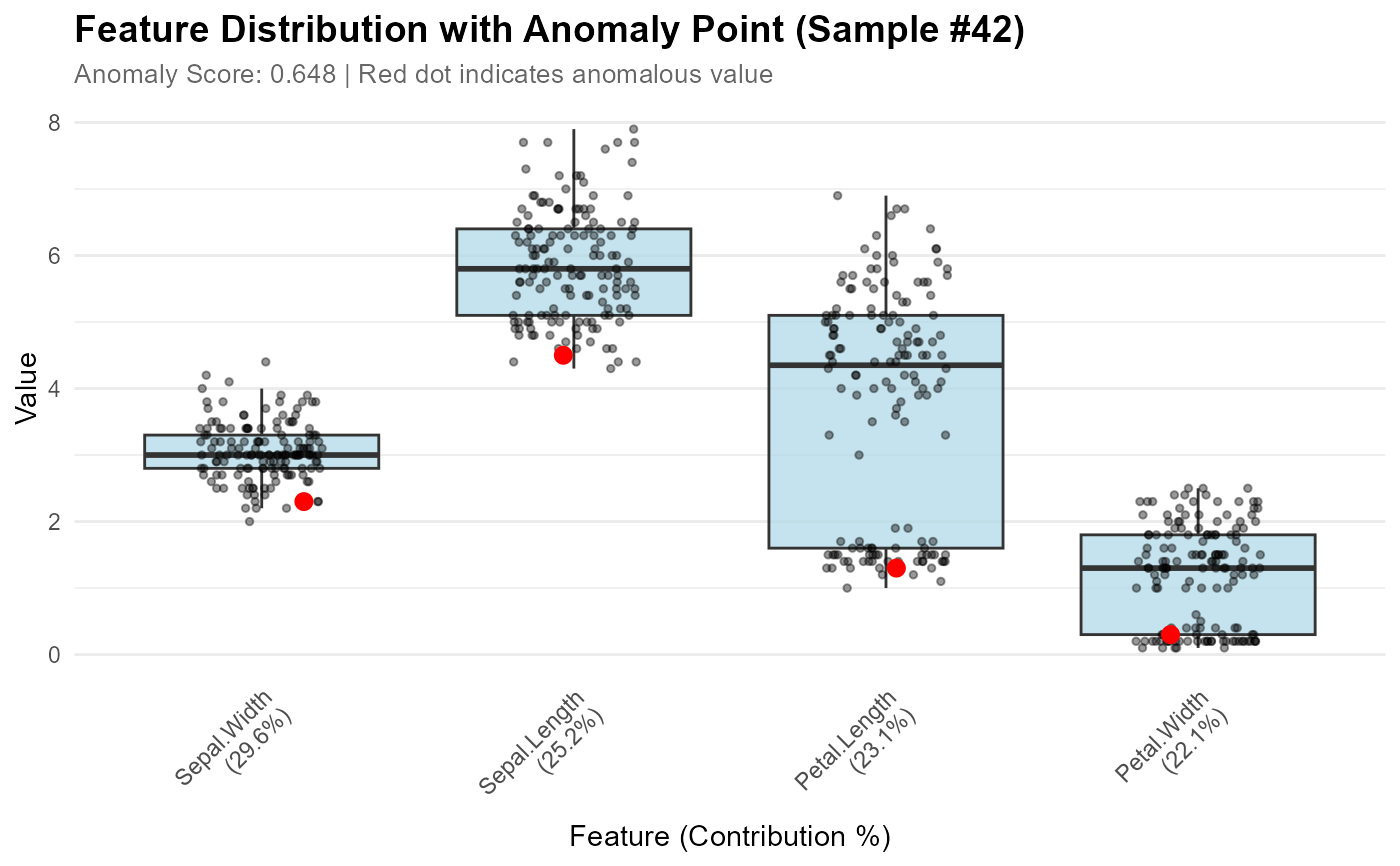
# With contribution object
model <- isoForest(iris[1:4])
contributions <- feature_contribution(model, sample_ids = 42, data = iris[1:4])
plot_anomaly_boxplot(contributions, iris[1:4], sample_id = 42)
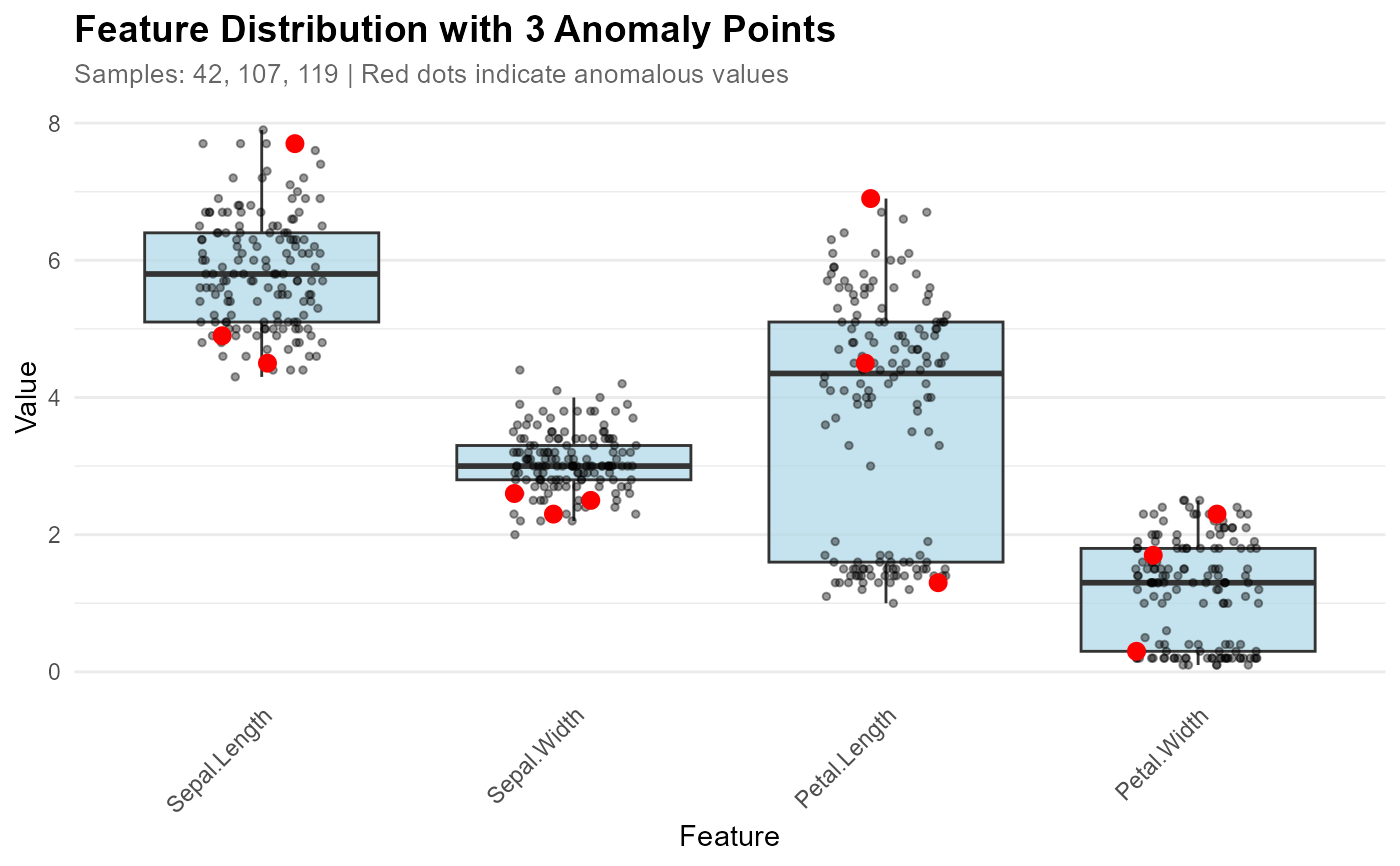
 # Without contribution object - mark multiple anomalies
anomaly_ids <- c(42, 107, 119)
plot_anomaly_boxplot(contribution_obj = NULL, data = iris[1:4], sample_id = anomaly_ids)
# Without contribution object - mark multiple anomalies
anomaly_ids <- c(42, 107, 119)
plot_anomaly_boxplot(contribution_obj = NULL, data = iris[1:4], sample_id = anomaly_ids)
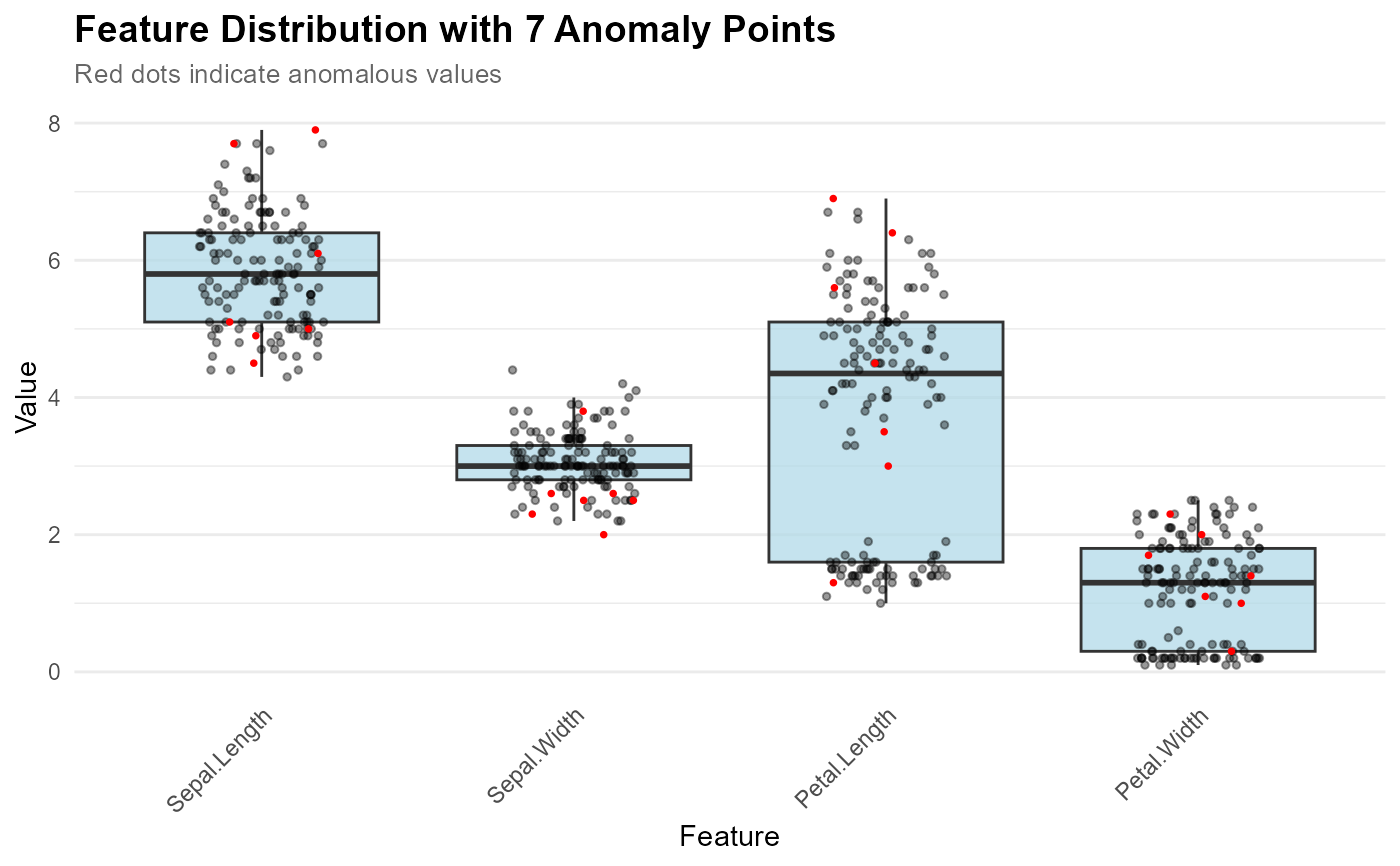
 # Many anomalies (auto-adjust size)
many_ids <- c(42, 61, 99, 107, 119, 132, 135)
plot_anomaly_boxplot(NULL, iris[1:4], many_ids)
#> Detected 7 anomalies (>5), adjusting point size to 1
# Many anomalies (auto-adjust size)
many_ids <- c(42, 61, 99, 107, 119, 132, 135)
plot_anomaly_boxplot(NULL, iris[1:4], many_ids)
#> Detected 7 anomalies (>5), adjusting point size to 1