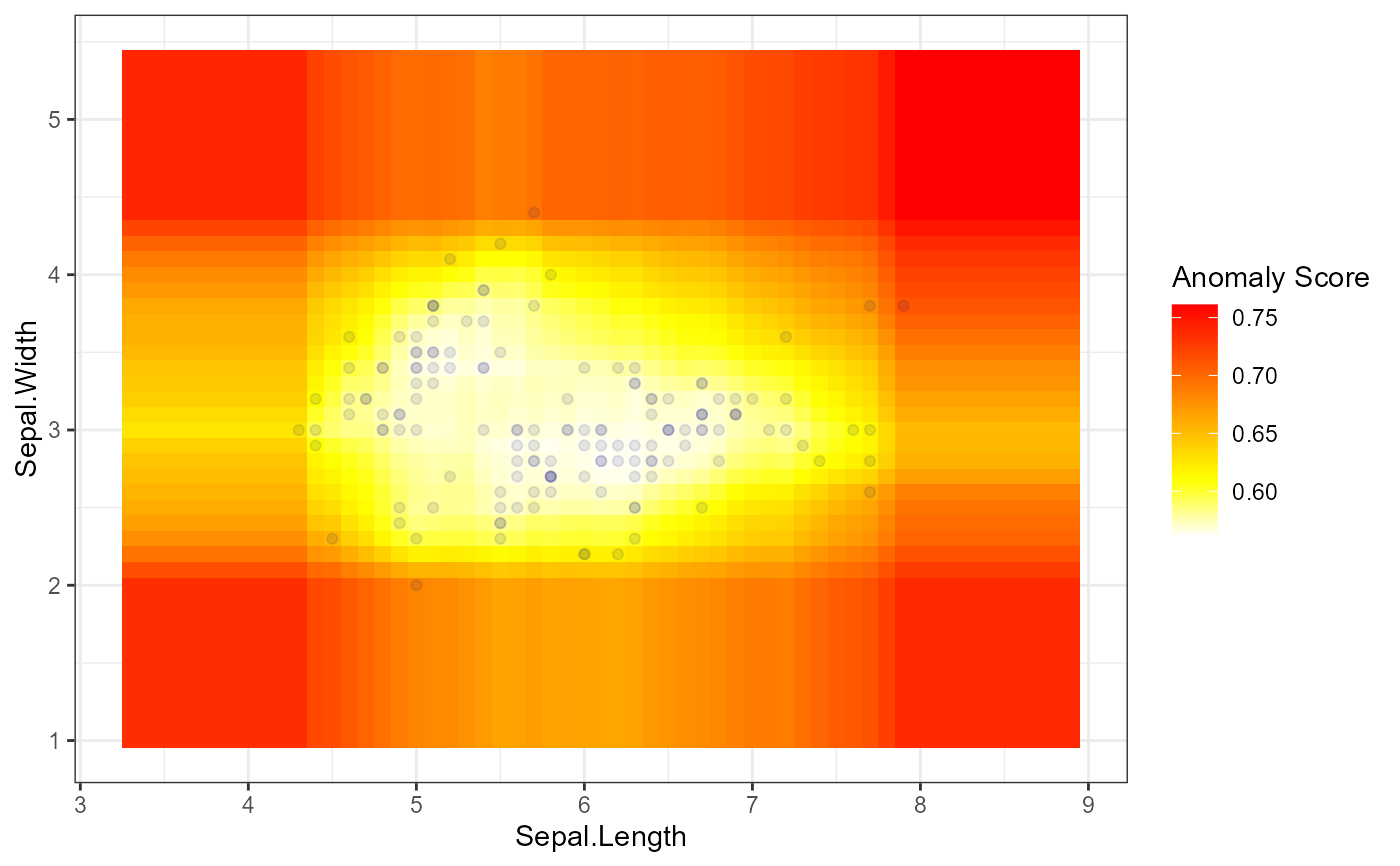
Plots the anomaly score heatmap or scatter plot for 2D data. This function is specifically designed for 2-dimensional data visualization.
Usage
plot_anomaly_basic(
object,
data = NULL,
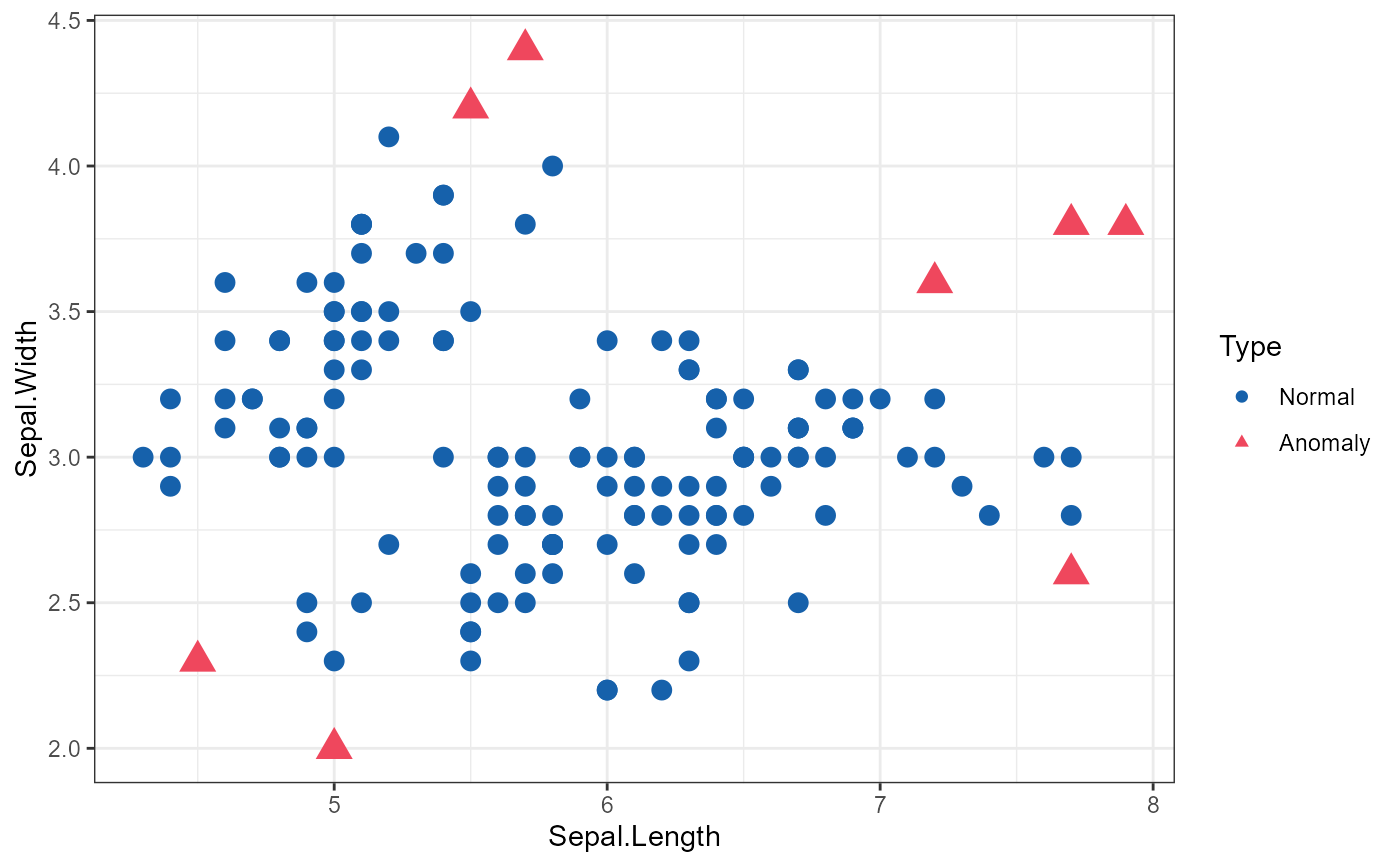
plot_type = c("heatmap", "scatter"),
contamination = 0.05
)Arguments
- object
The fitted isoForest model object
- data
The data to be plotted (must have at least 2 columns).
- plot_type
The type of plot to be generated. Either "heatmap" or "scatter".
- contamination
The proportion of outliers in the data. Default is 0.05. This parameter is used to determine the threshold for anomaly scores.