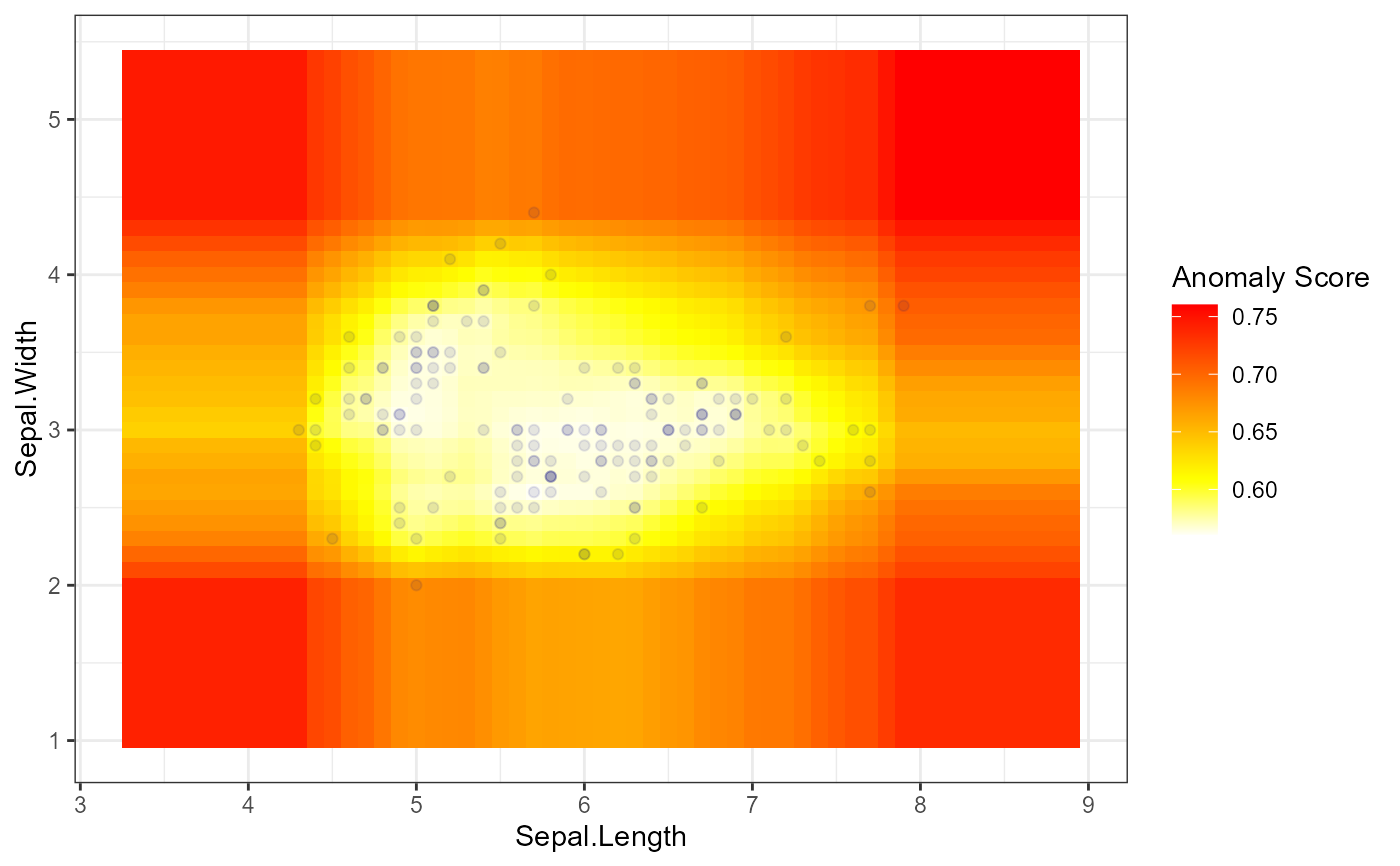
Plots the anomaly score heatmap for each point in the space.
Usage
anomaly_plot(
  object,
  data = NULL,
  plot_type = c("heatmap", "scatter"),
  contamination = 0.05
)
Arguments
- object
The fitted isoForest model object
- data
The data to be plotted.
- plot_type
The type of plot to be generated. Either "heatmap" or "scatter".
- contamination
The proportion of outliers in the data. Default is 0.05. This parameter is used to determine the threshold for anomaly scores.
Examples
# Load the data
data("iris")
# Fit the anomaly detection model
model <- isoForest(iris[1:2])
# Plot the anomaly scores
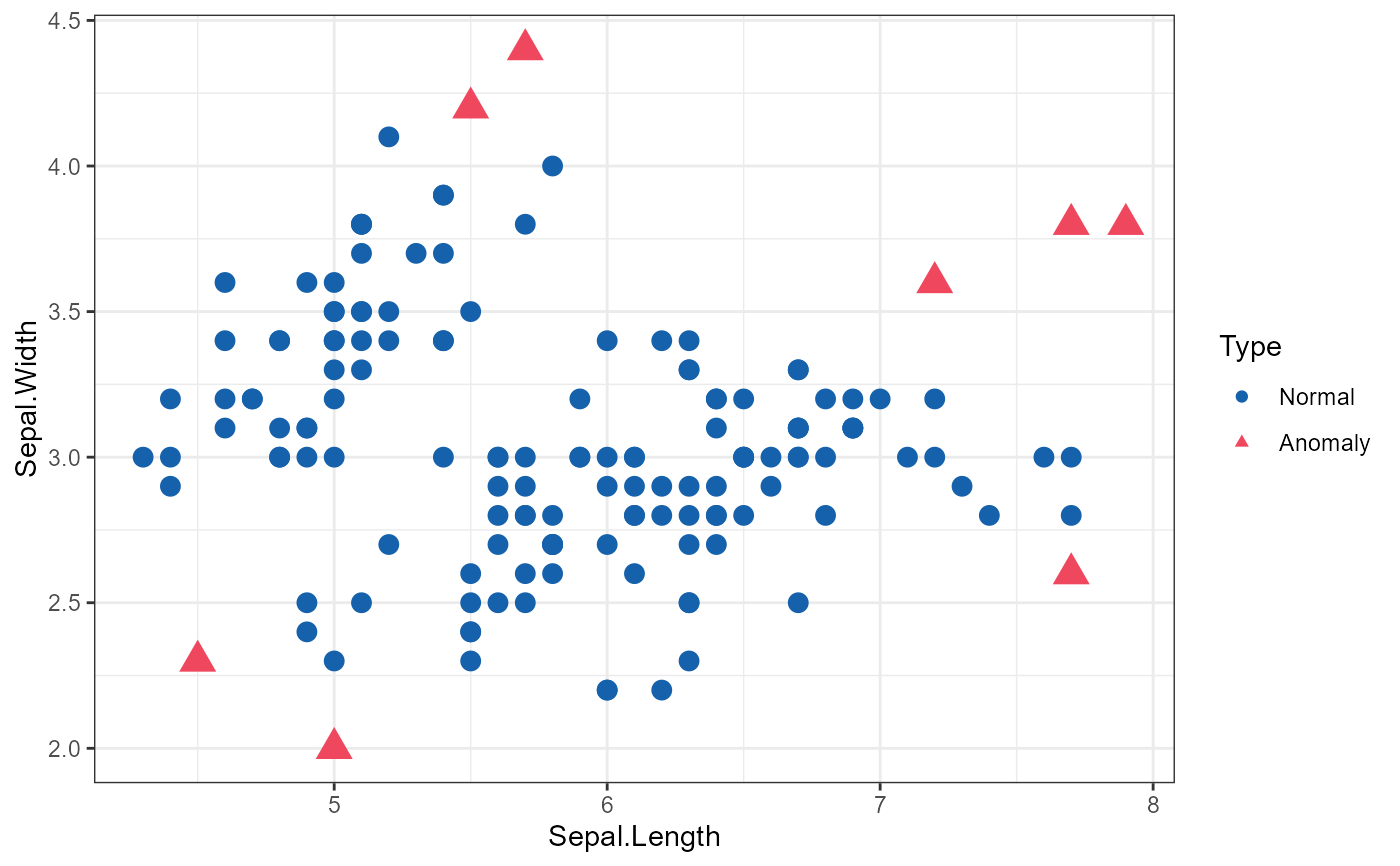
anomaly_plot(model, iris[1:2], plot_type = "scatter")
 anomaly_plot(model, iris[1:2], plot_type = "heatmap")